
Know the environment.
An MLB game page starts with where the game is being played. The outfield wall is drawn from the park’s real fence distances, with the forecast wind moving across it.
400feet to center at Wrigley Field
11.5mph, the wind in from right field that afternoon
The park, to scale
Five fence distances and their wall heights, all on one scale, so a short porch looks like one.
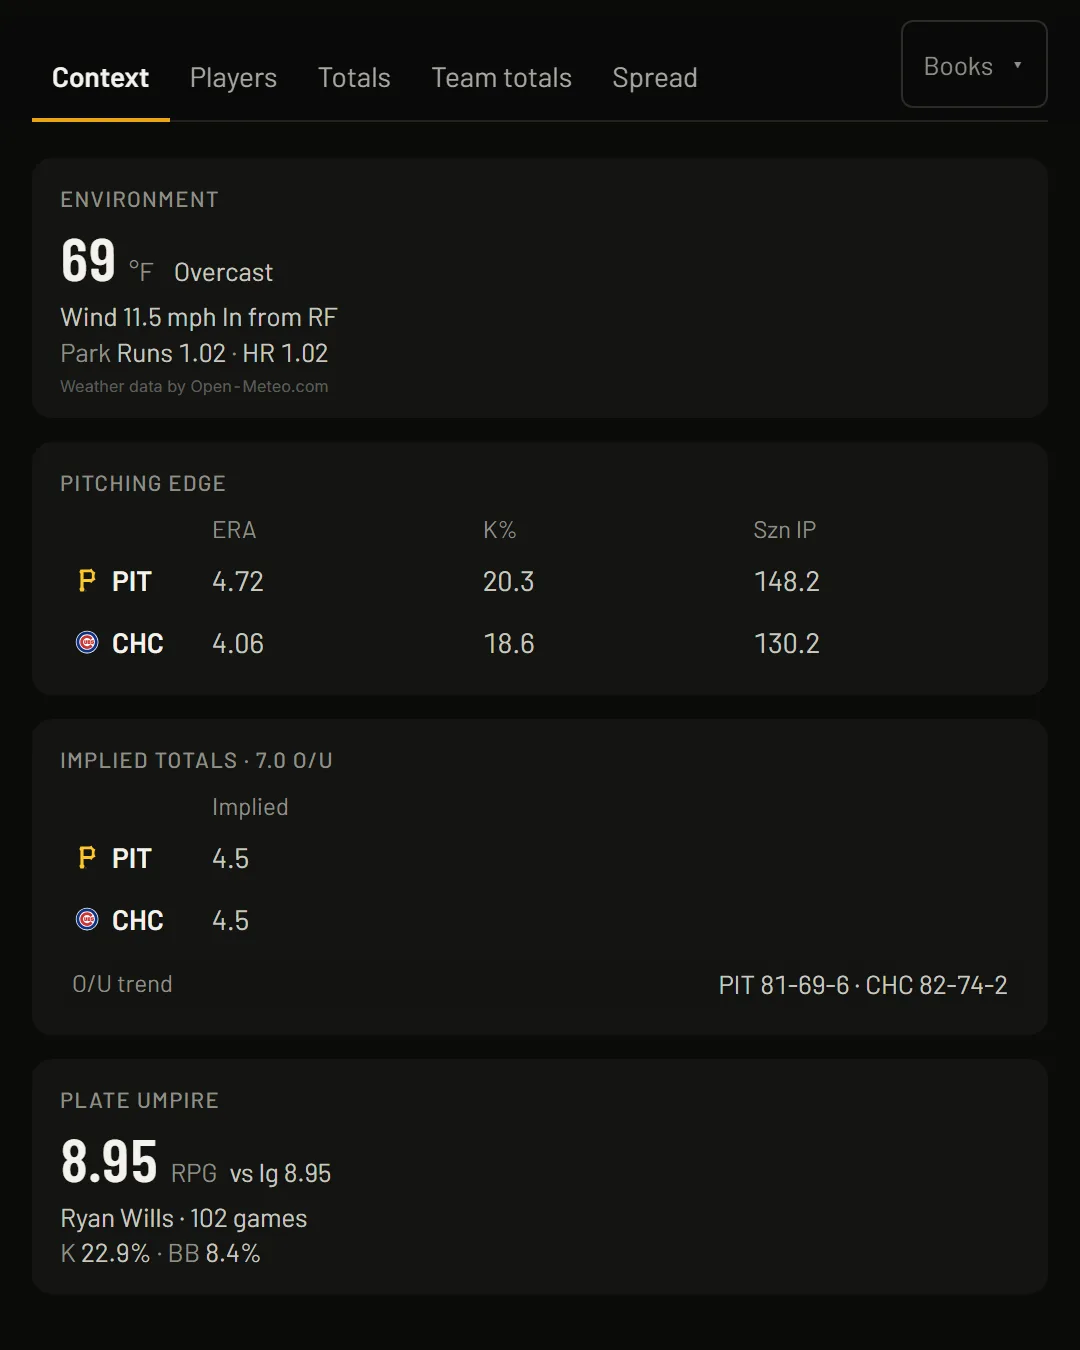
Wrigley Field: 355 to left, 400 to center, 353 to right. That afternoon the wind was 11.5 mph, blowing in from right field.
The wind is the forecast for the hour nearest first pitch, drawn the way it crosses that park: out to center, in from left, across. When the roof is closed the arrows come off.
Beside the drawing are the park’s factors for runs, home runs, hits and strikeouts, each ranked against the other parks.
Behind the plate
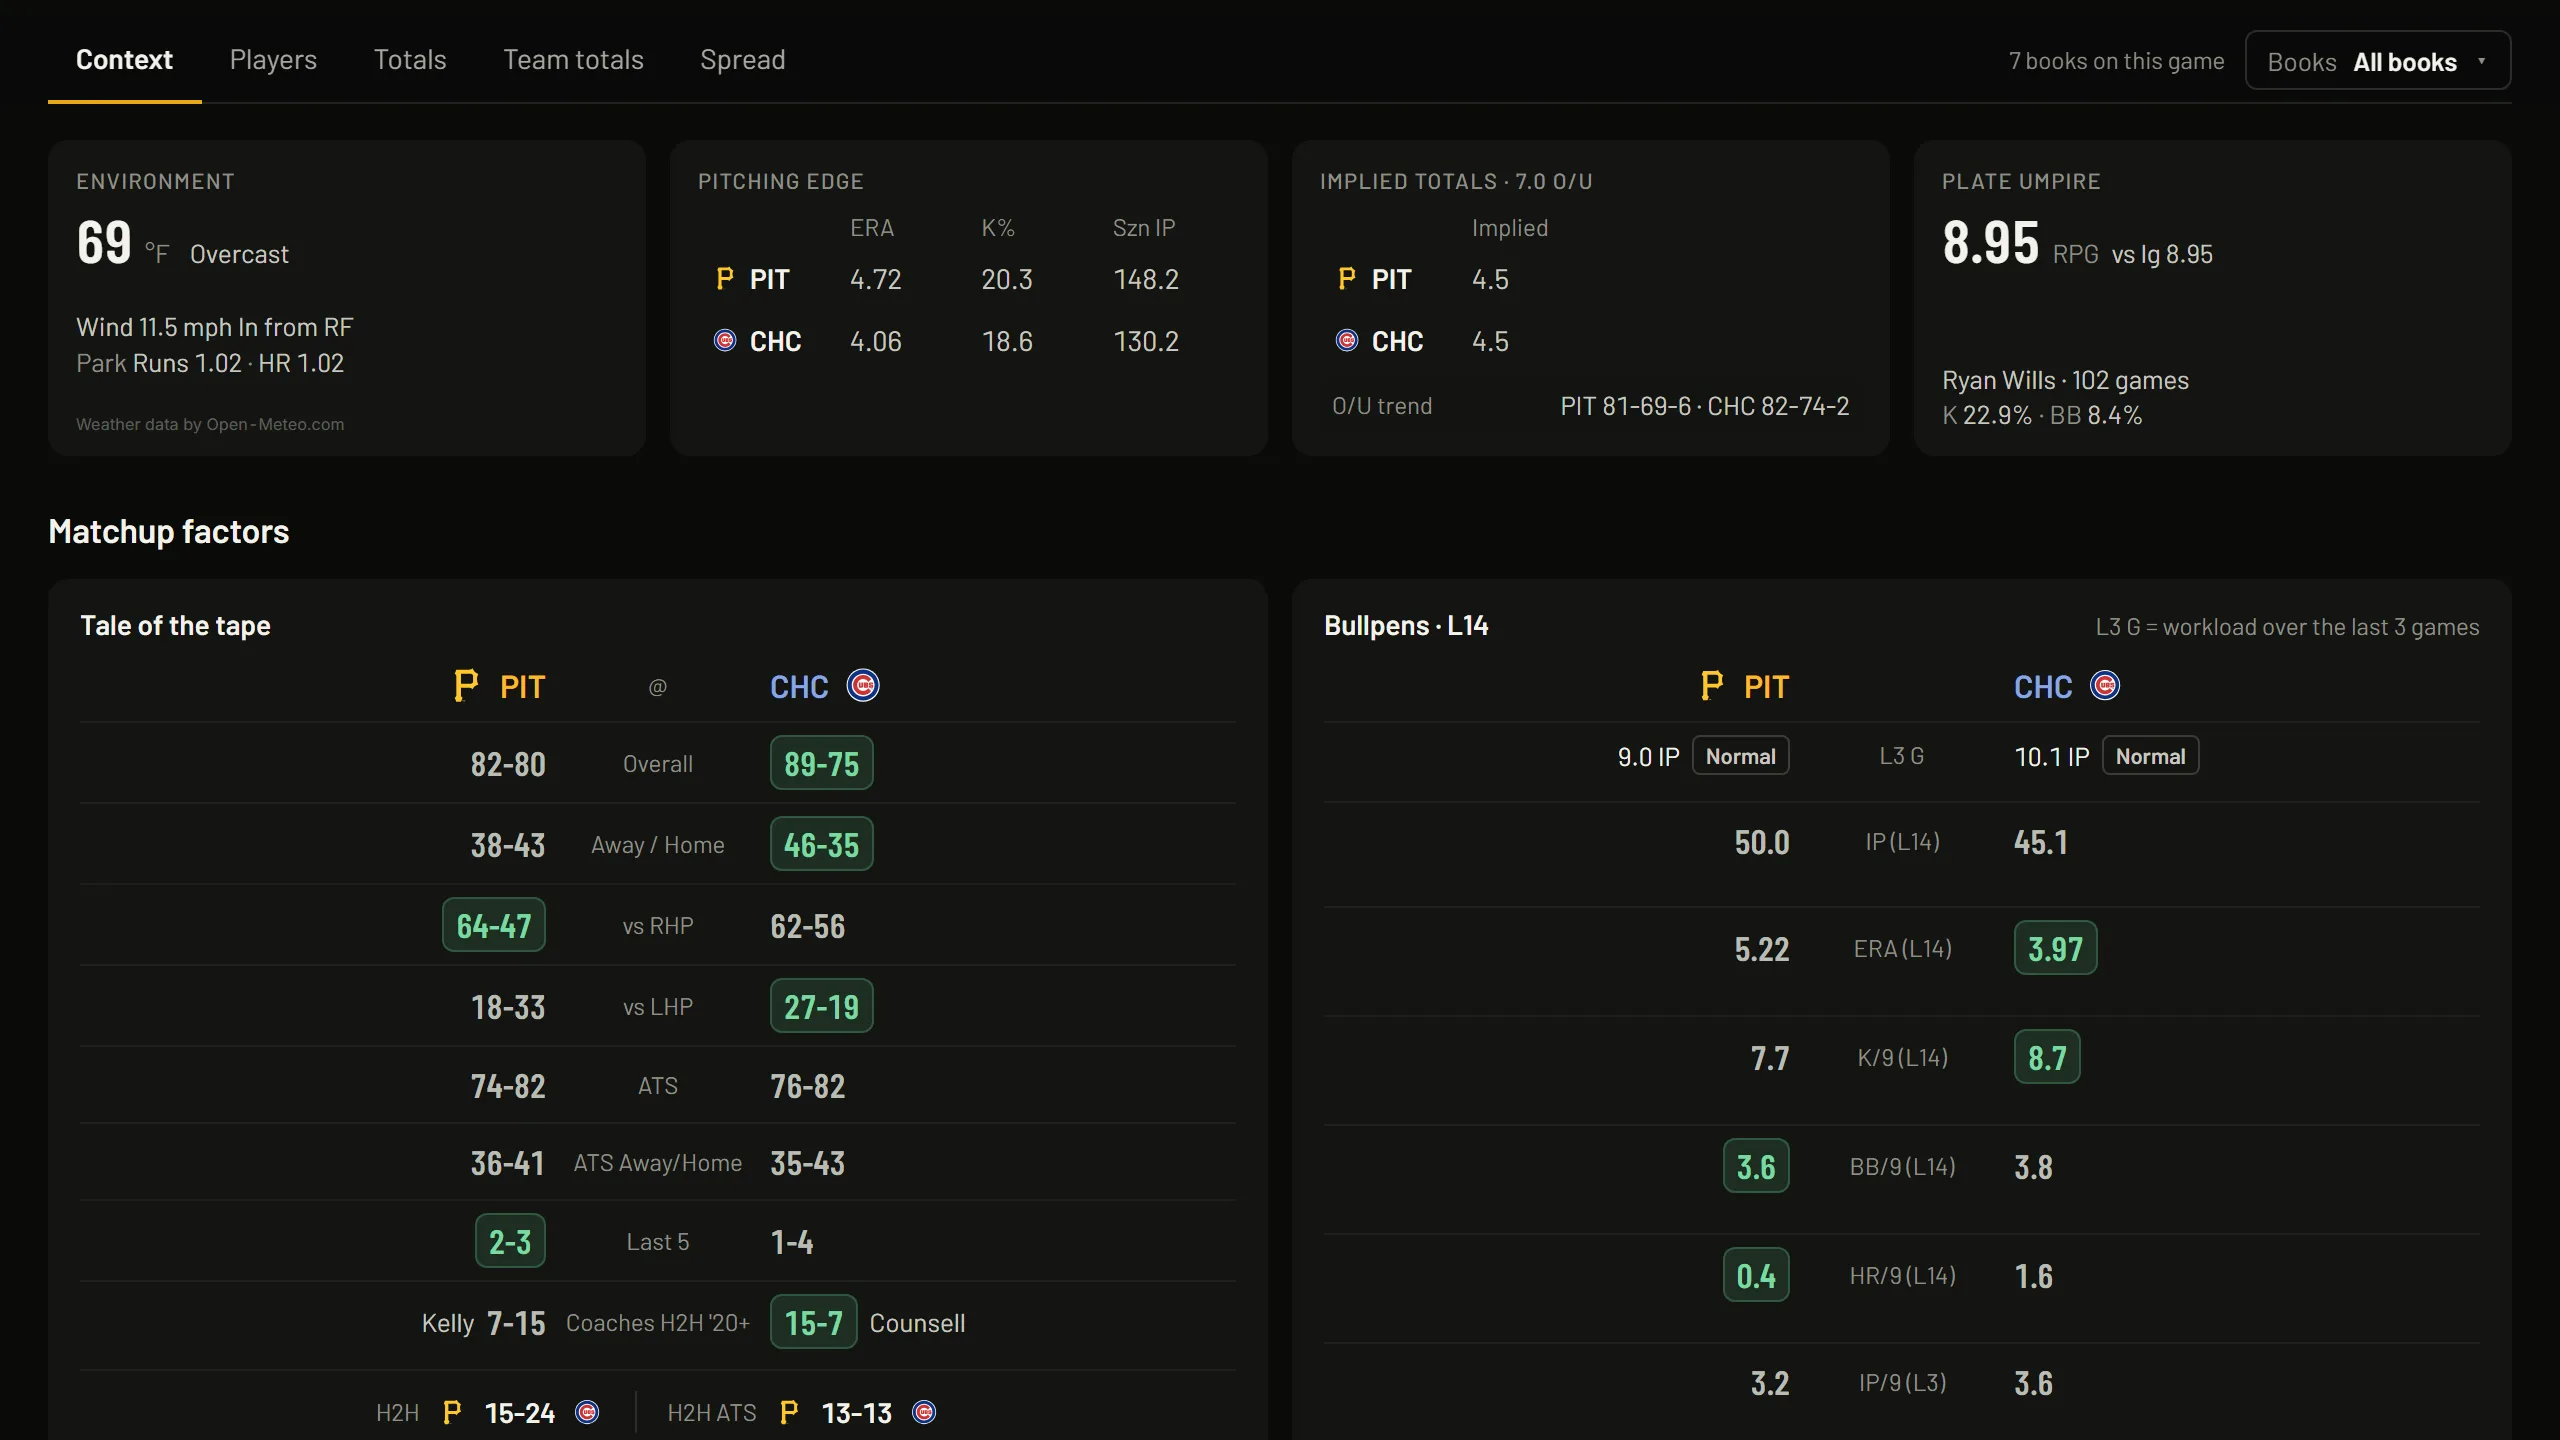
Once the plate umpire is assigned, his card shows runs per game, strikeout rate and walk rate in the games he’s called, each beside the league’s. Under 30 games, the numbers stay blank.
Bullpens
Each bullpen’s innings over the team’s last three games, tagged from fresh to gassed, with the relievers likely unavailable named.
Under that: ERA, strikeouts, walks and home runs per nine over the last 14 days, relief appearances only.
What the hitter’s about to see
Every batter’s card has his results against each pitch type tonight’s starter throws: average, slugging, strikeout rate, exit velocity.
A probable starter appears once the league lists him. Until the official batting order posts, the page shows one built from the team’s recent lineups and labels it.
Off-season
MLB is between seasons. Lines, lineups, weather and the daily free game come back with the schedule.
The rest of the slate is $19.99 a month plus applicable tax. One plan covers every sport.
21+ only. Gambling involves risk. Never bet more than you can afford to lose. If you or someone you know has a gambling problem, call 1-800-GAMBLER.