
Zoom all the way in on one player.
Every player with a line tonight has a page. It opens on his recent games, drawn as bars against tonight’s number.
Change the number or the situation and the count is redone from the same games.
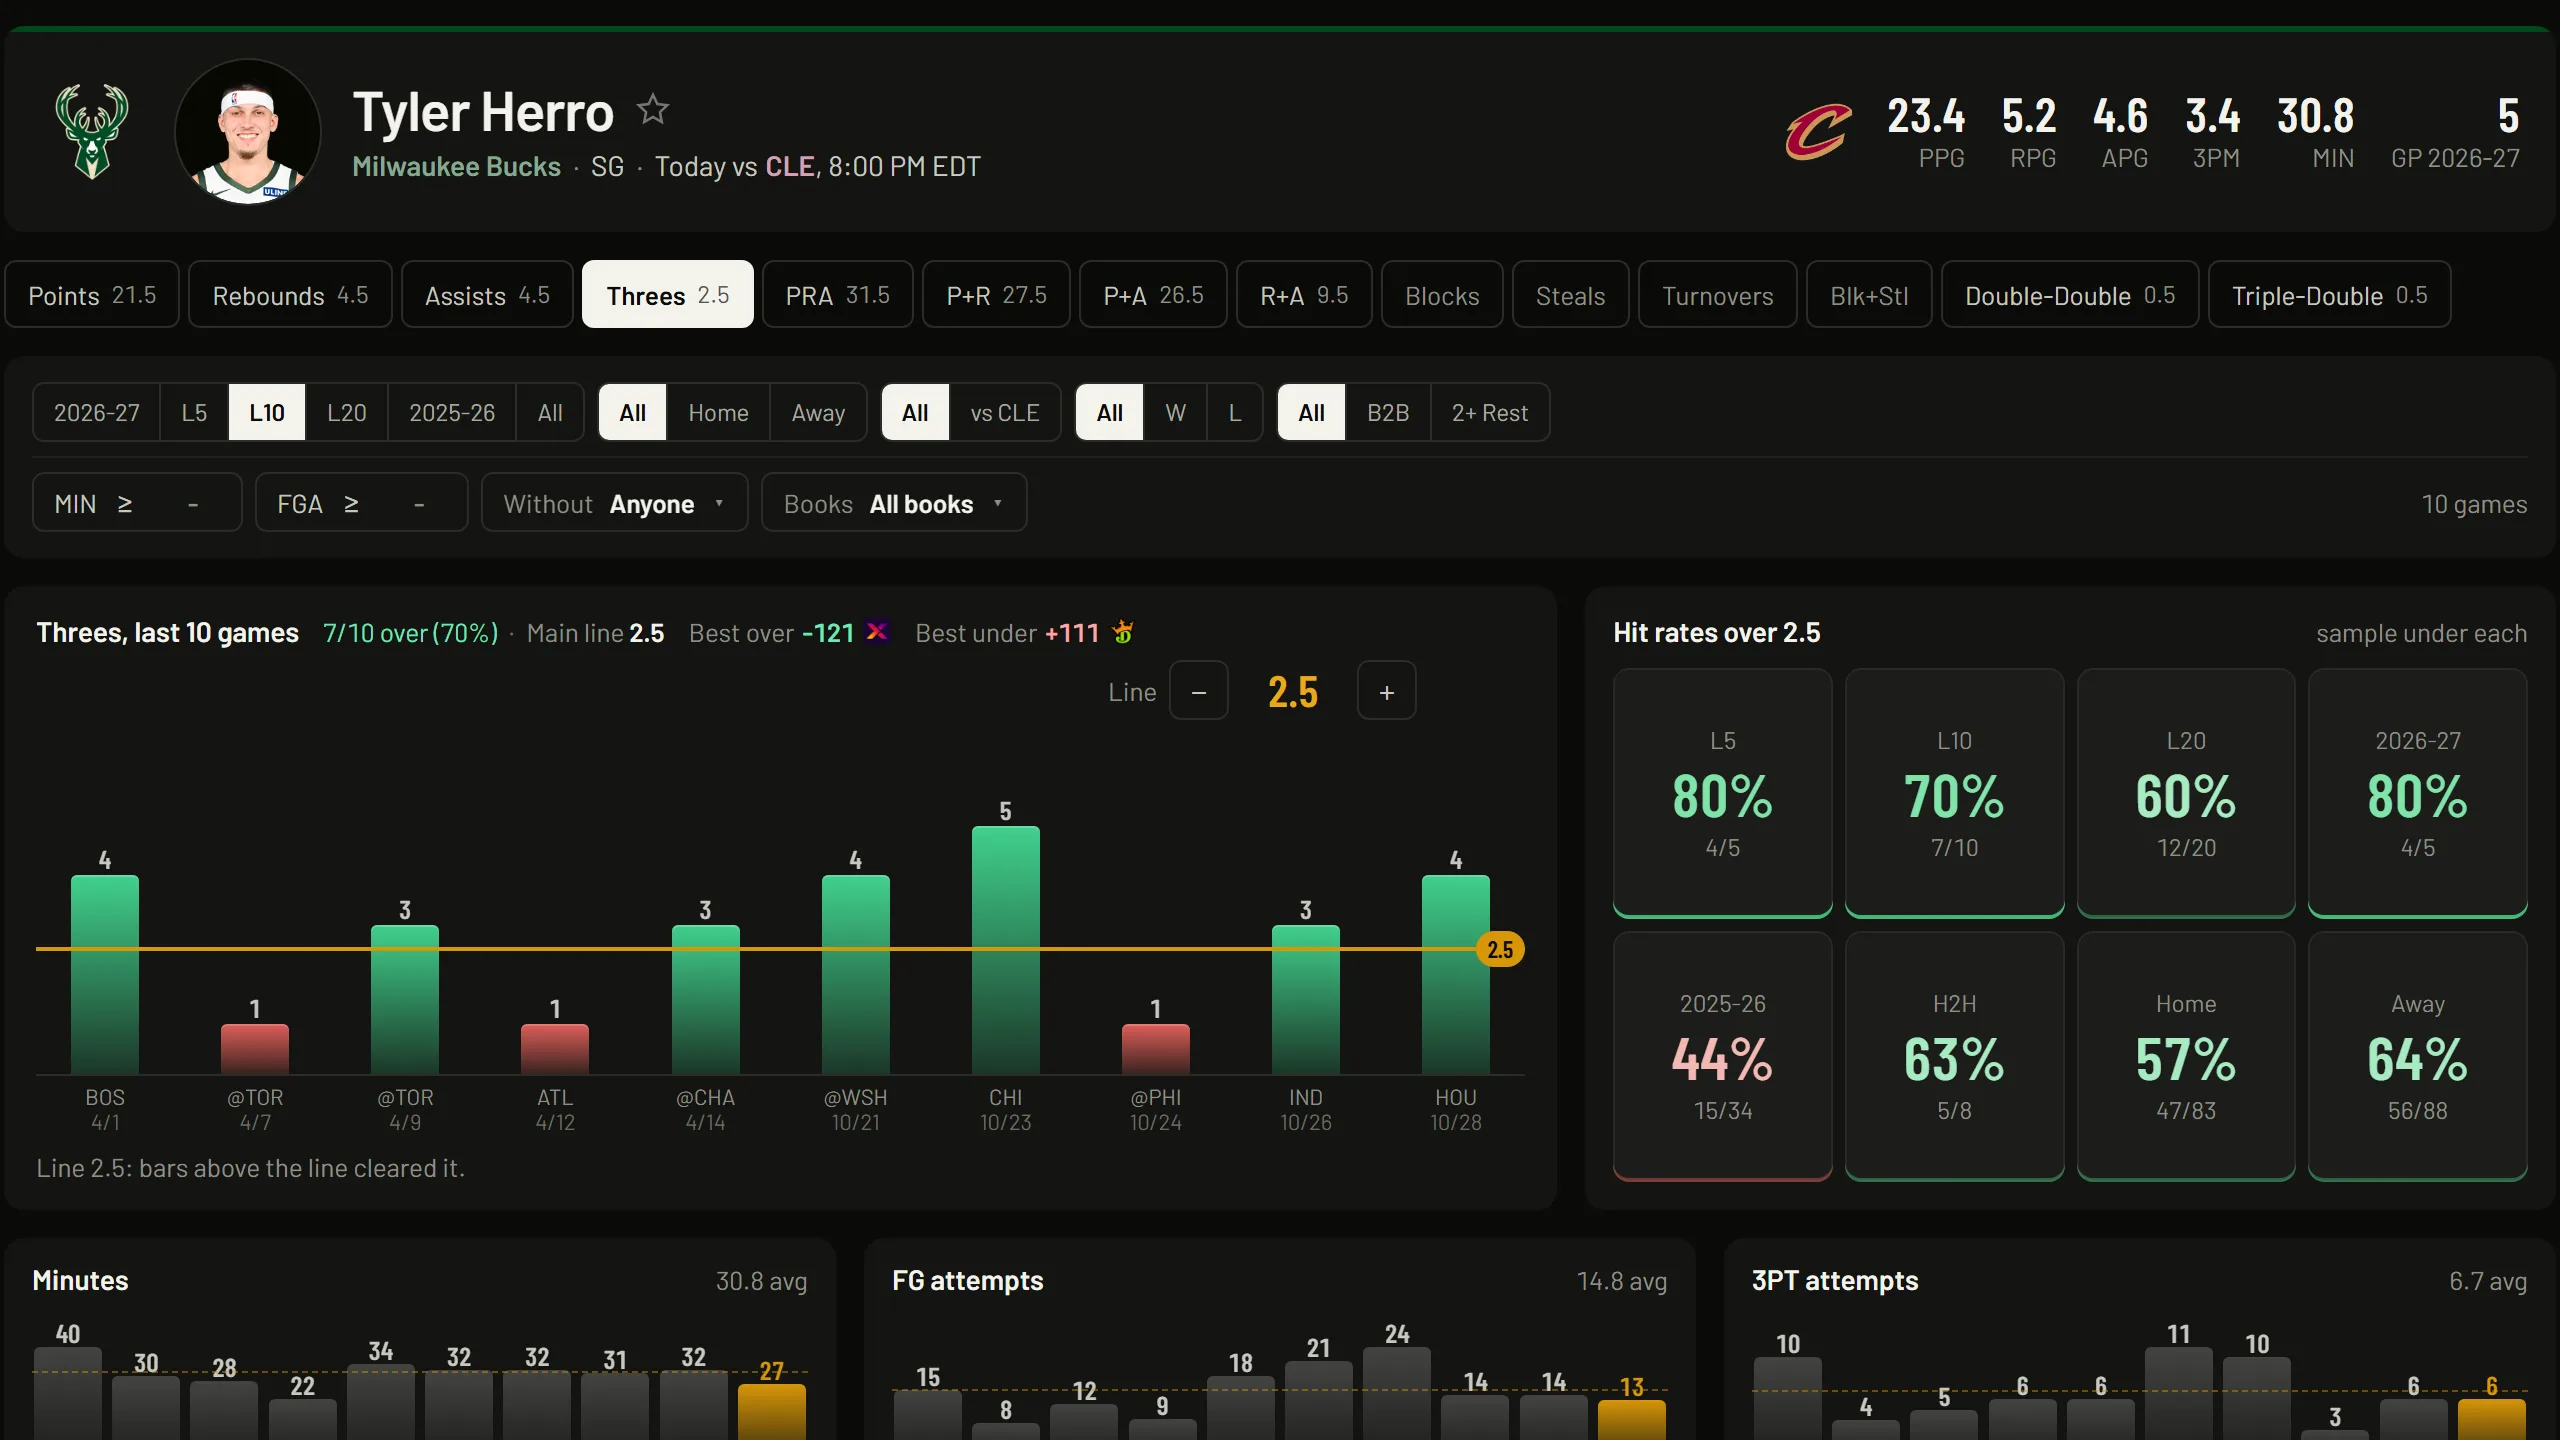
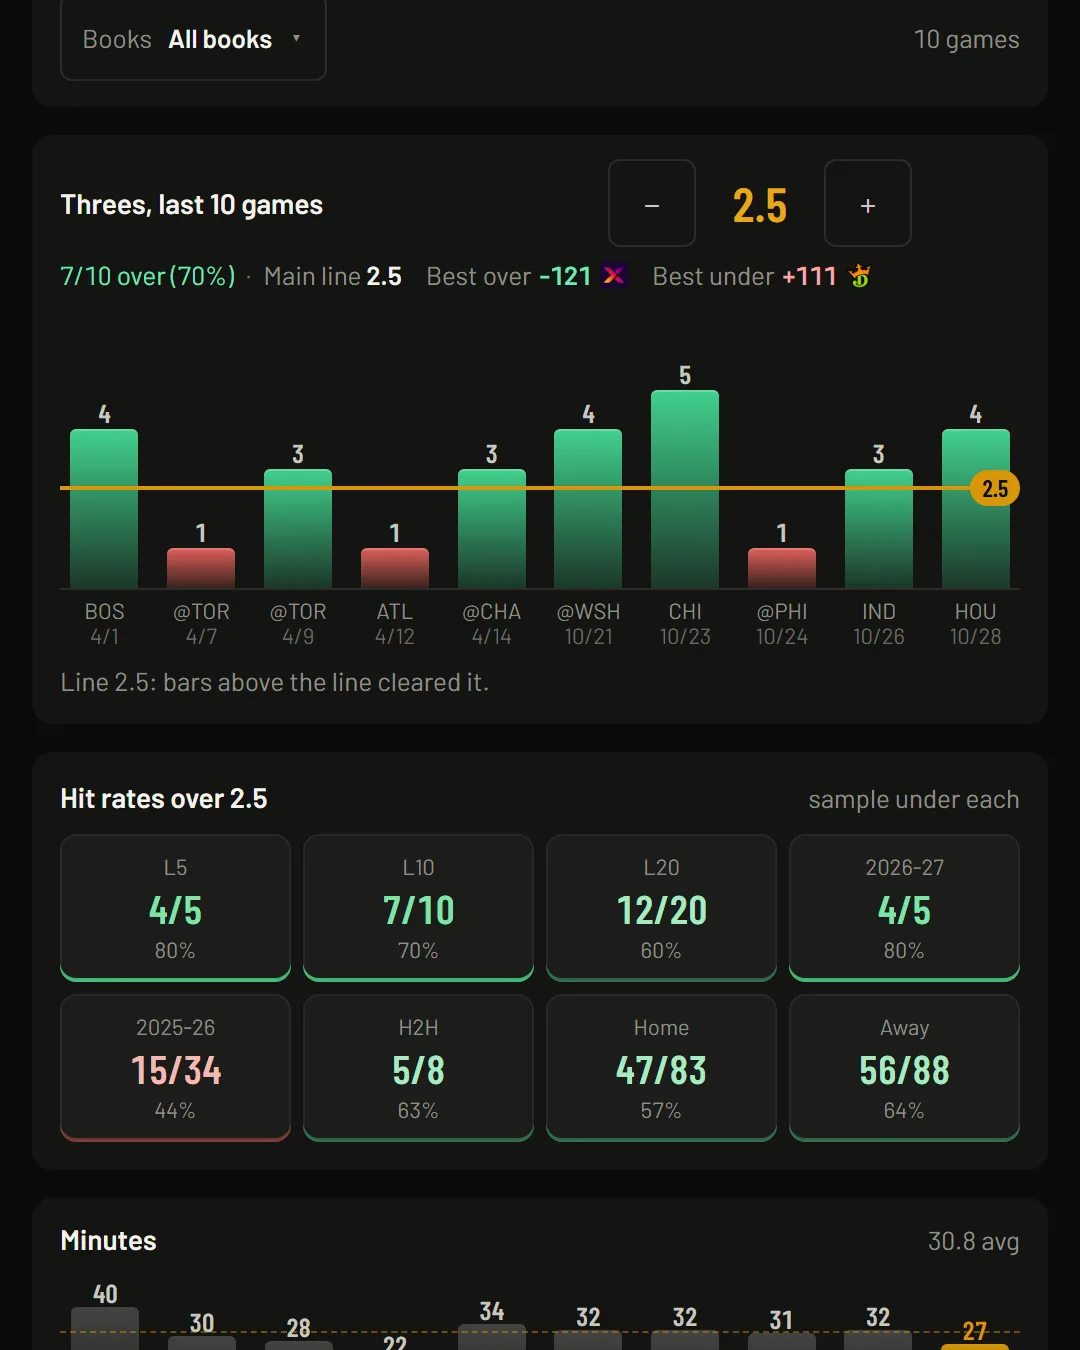
7 of 10Tyler Herro, threes, over 2.5
4 of 10the same ten games, over 3
His last games, at tonight’s number
Each market he has a line in is a chip across the top, with the line printed on it. Choose one and the chart draws his last 10 games as bars. Green cleared the line. Red didn’t.
Next to the chart are eight hit rates at that same line: the last 5, 10 and 20, this season, last season, head to head against tonight’s opponent, home and away. The count sits under each percentage.
A game that lands right on the number doesn’t count as over.
Move the line
The line has a minus and a plus. Each press moves it half a point, and the bars and all eight hit rates recount at the new number. You can type one in too.
Tyler Herro, threes: over 2.5 in 7 of his last 10. One press up to 3 and it’s 4 of 10.
The price doesn’t move with it. Books post one main line on most props, so a stepped number carries a price only when a book has that exact line. Soccer shots, shots on target and assists come in several lines, and each one has its price.
Tonight’s situation
Filters cut the same games down to the ones that look like tonight: home or away, or against this opponent. They stack, and the hit rates recount each time.
After that it depends on the sport.
- NBA and WNBAWins or losses, back-to-backs or rest, a floor on minutes or shot attempts, and games a teammate missed.
- NHLWins or losses, rest, ice time, and games a teammate missed. For goalies, shots faced.
- NFLWins or losses, prime time, one quarter or one half, the spread, the total, games with or without a teammate, and ranges on targets, carries or attempts.
- MLBLeft-handed or right-handed starter. For pitchers, starts or every appearance.
- SoccerStarts or every match, and the first half or the second.
What each sport draws
- NBA and WNBAShot zones on two half courts: his, and tonight’s defense against his position. Last 5, 10 or 20 games, or a season, with each zone colored against the league.
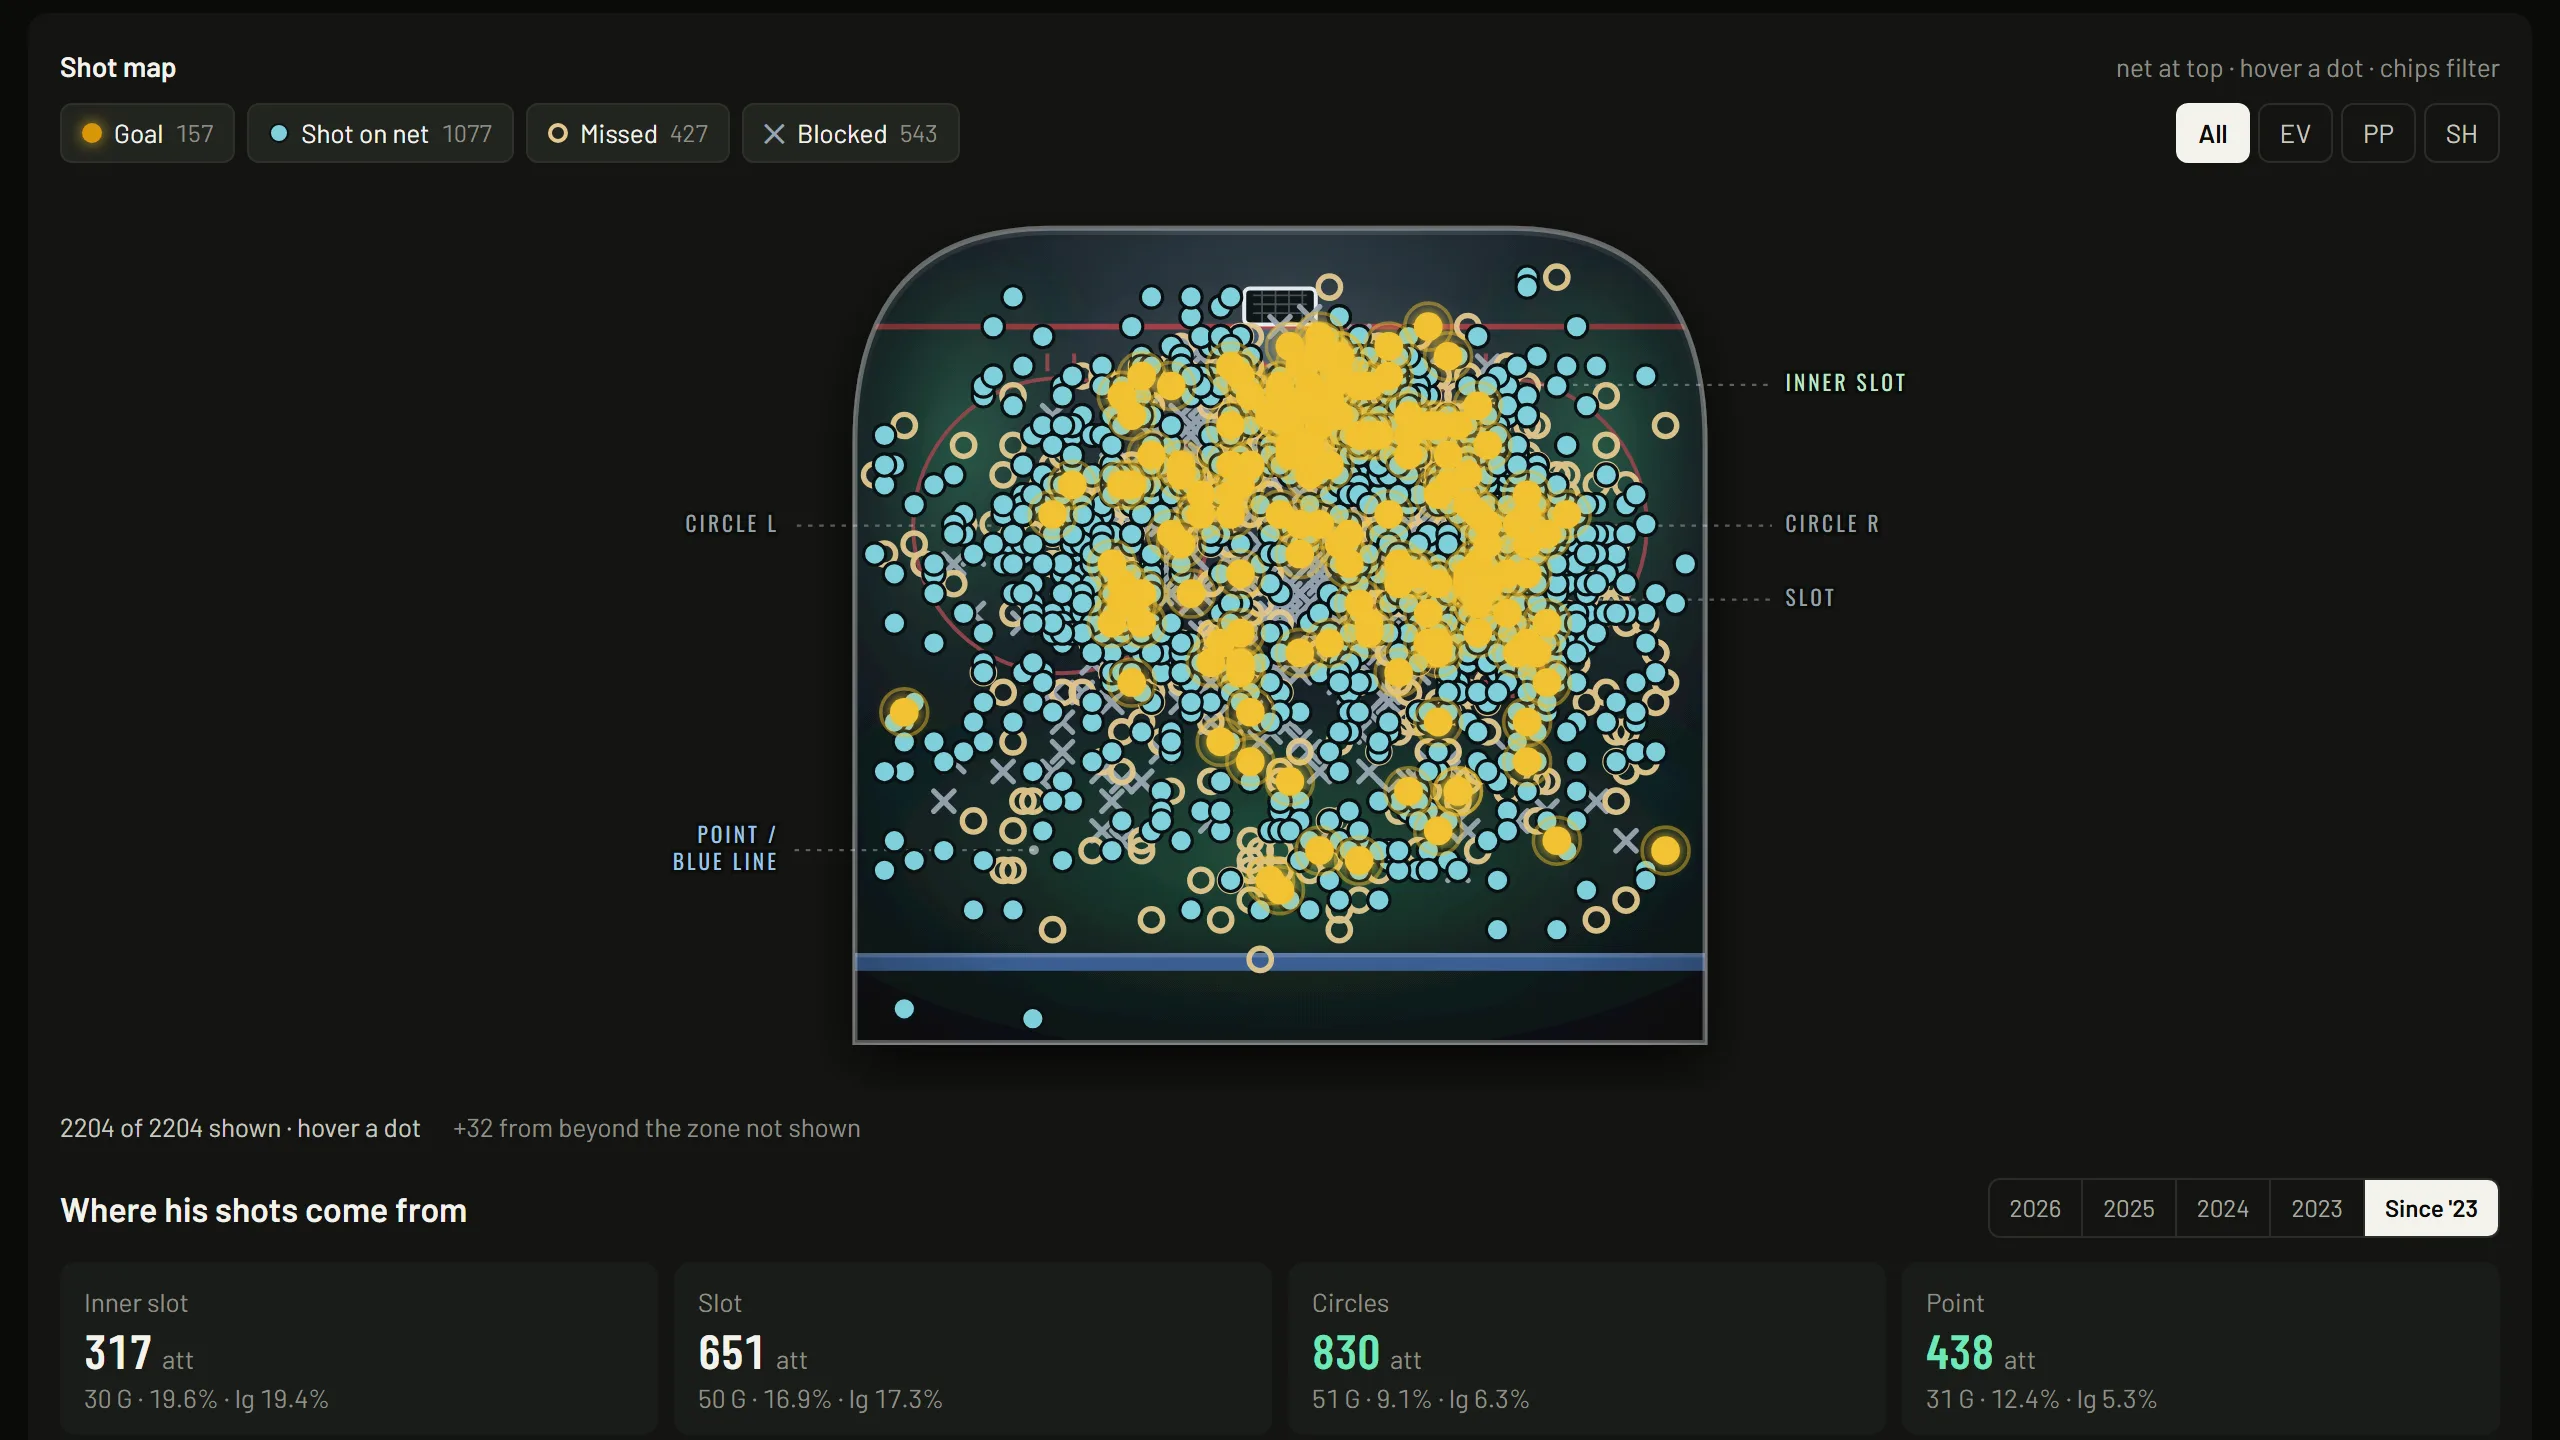
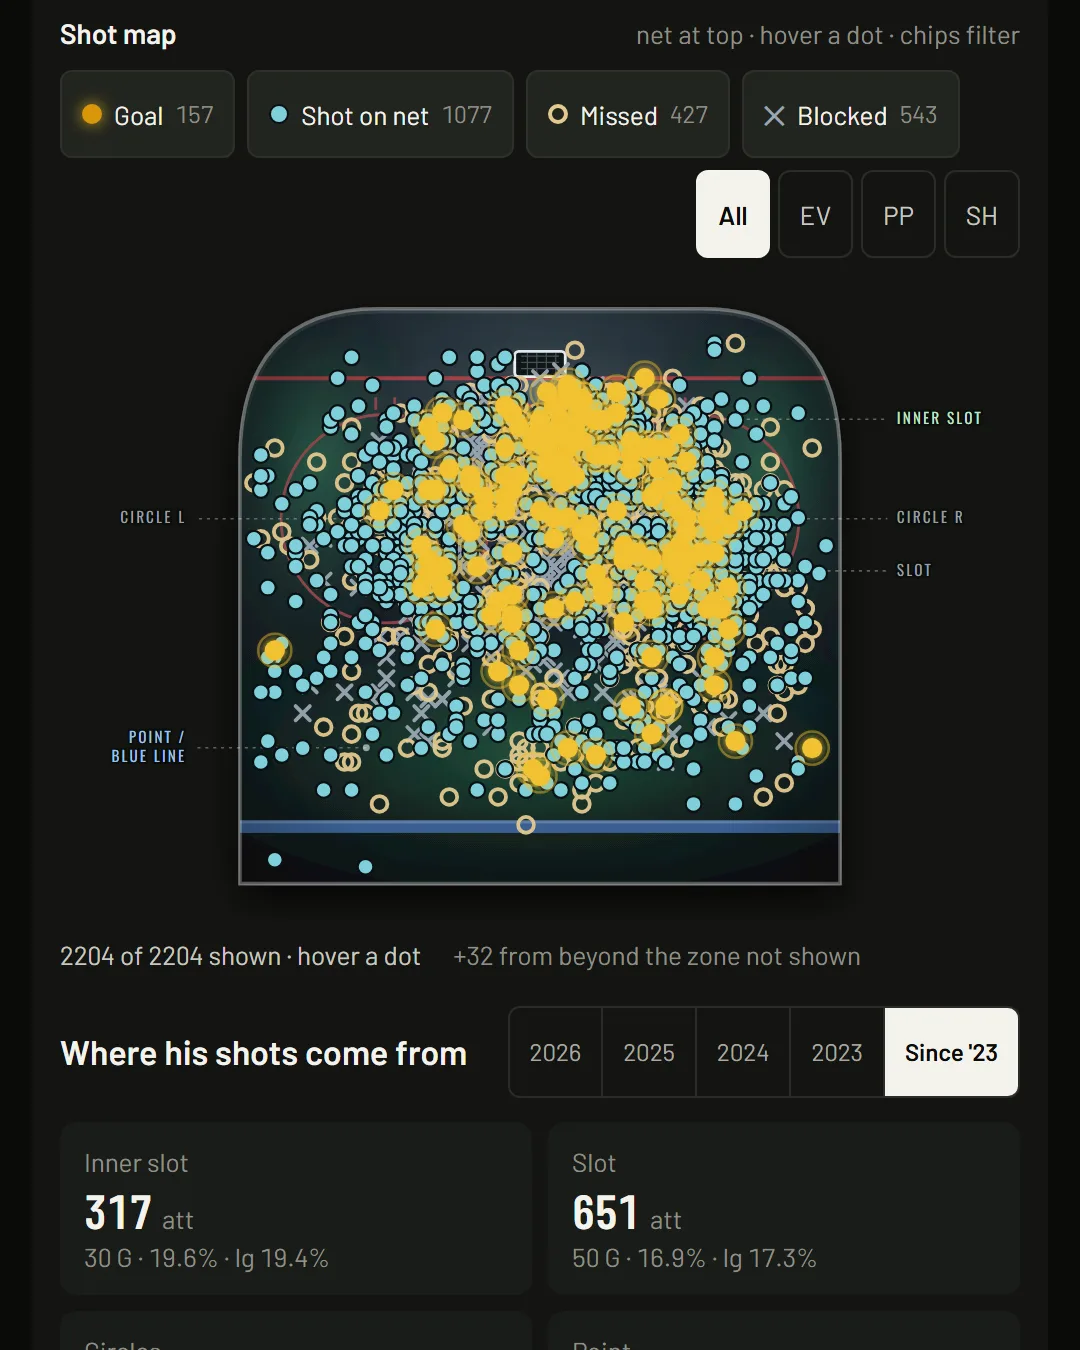
- NHLThe shot map. Every attempt is a dot on the rink, and chips filter by result and by even strength, power play or shorthanded. Goalies get a save map.
- NFLA target map for receivers, a passing chart for quarterbacks and rush gaps for backs, each beside what tonight’s defense allows in the same zones. Kickers and defensive players have pages too.
- MLBFor a hitter: his results against the pitches tonight’s starter throws, where he hits the ball and which zones he hits. For a pitcher: the arsenal, the zones he gets hurt in and the plate umpire’s numbers.
- SoccerA pitch marked with where he has started and where he starts tonight, and his hit rate from each spot.
Since ’23
The history starts somewhere: 2020 for MLB and the NFL, 2022 for the WNBA, 2023 for the NBA and the NHL.
When a player’s record runs back to that first season, the all-seasons view is labeled with the year: “Since ’23” for an NBA veteran.
My Players
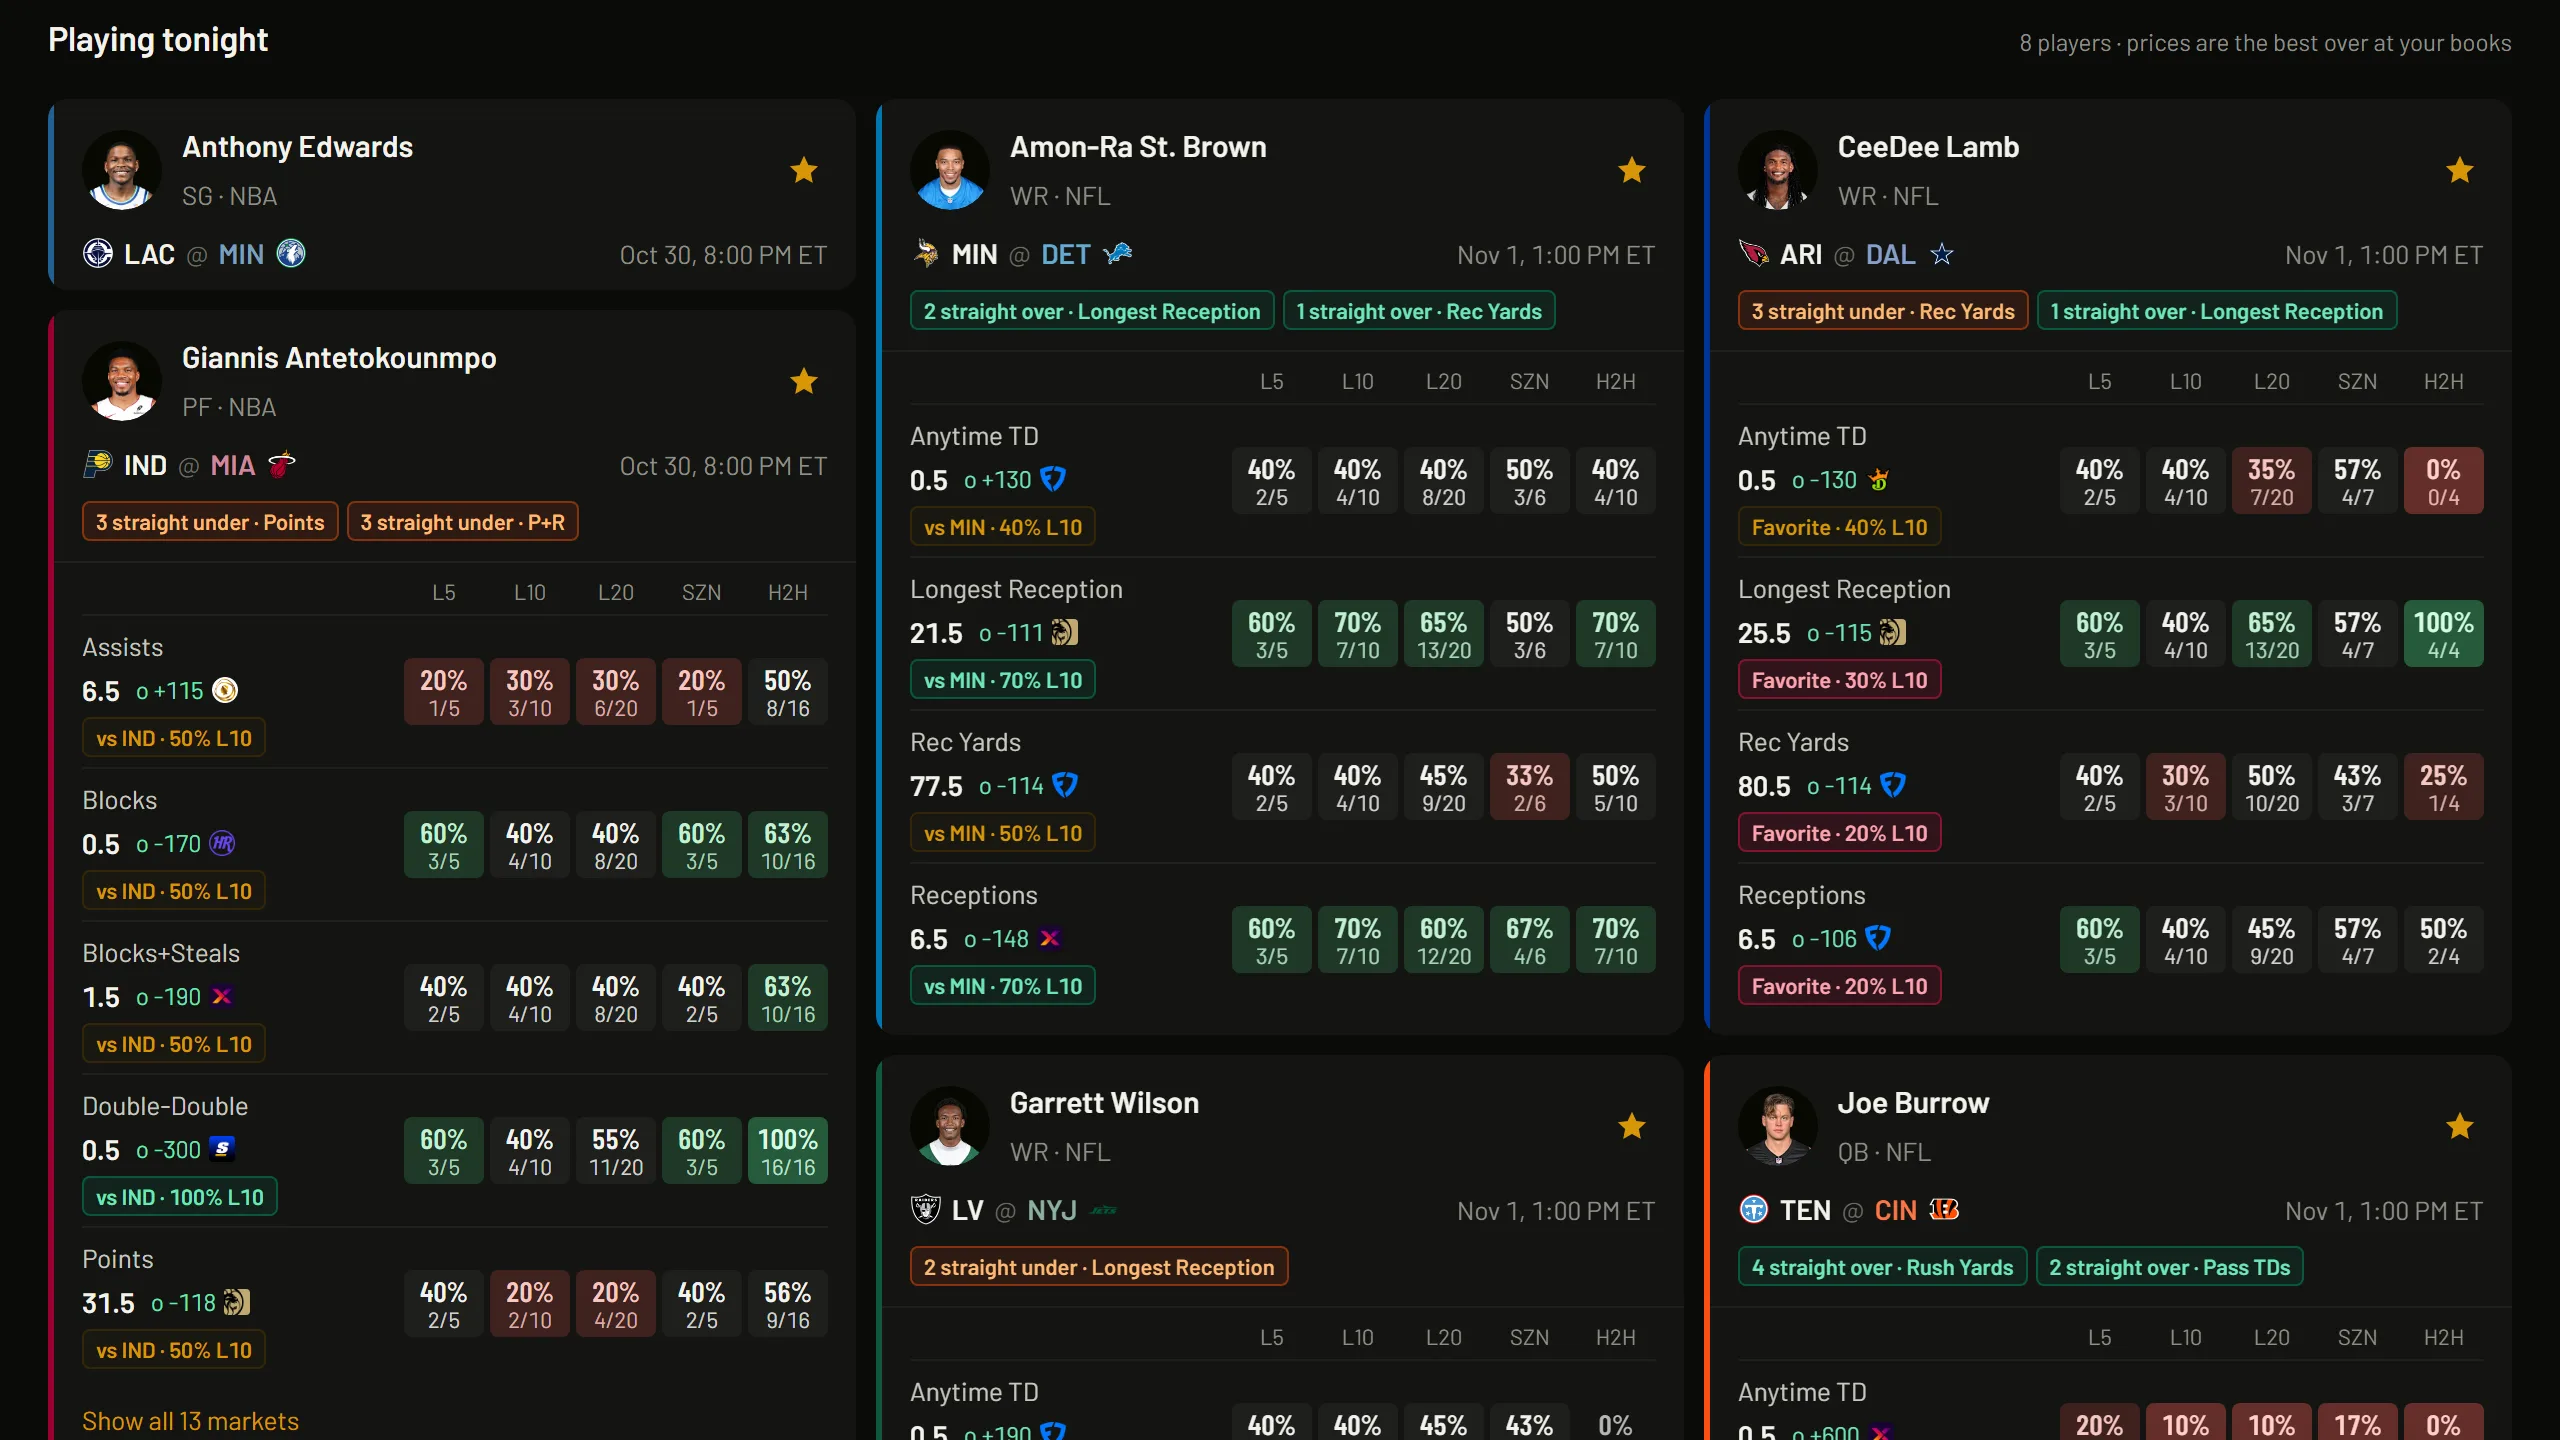
Star a player anywhere in the Nexus and he’s on your list. The list is saved to your account and holds up to 100 players.
My Players shows the ones playing tonight: the line, the best over price at your books, and hit rates for the last 5, 10 and 20, the season and head to head. Players with the night off are listed with their next game.
Above the cards is a feed of the last 72 hours: a line was posted, an MLB lineup went official, a streak reached three.
What’s free
On a free account, the free game’s players are open, both teams. WNBA and soccer player pages and My Players are part of the subscription.
The rest of the slate is $19.99 a month plus applicable tax. One plan covers every sport.
21+ only. Gambling involves risk. Never bet more than you can afford to lose. If you or someone you know has a gambling problem, call 1-800-GAMBLER.